The balance sheet is one of the three core financial documents for running your business, along with your cash flow forecast and the profit and loss.
Its main purpose is to show at a glance what the company owns and owes, so it particularly focuses on the assets of the business and shows overall solvency. The cash flow forecast shows cash inflows and outflows and the P&L looks at overall and profitability.
The balance sheet looks at how well your business is doing at a particular point in time, so you should be looking at it monthly or quarterly at a minimum.
Putting together your balance sheet
There are two ways of creating your balance sheet.
The old-fashioned way is to create one on Excel, or maybe download an Excel template from the internet, and input your figures each month. If you have money to spare you can alternatively pay your accountant to produce it for you.
The simple and modern way is to do your book-keeping on one of the many online accounting software systems, and they will automatically generate this and other financial information at the click of a mouse! If you already use such a package, this and other useful management information will be in the reports section.
So, what are the important things to look out for? Take a look at this example start-up business balance sheet.
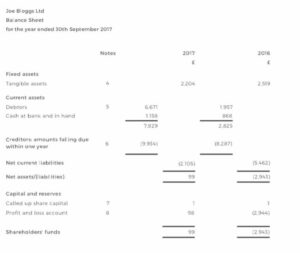
Right click the image above and select ‘save image as’ to download the template.
Fixed assets
The first area to look out for is your ‘fixed assets’ row, which covers things like computers, furniture, stock and other physical items.
This will rather depend on what type of business you are. For office businesses and others that do not carry stock and equipment, this should be low. However, for businesses with lots of equipment and inventory, such an manufacturers, retailers and restaurants, this is an important area to watch.
Problems can arise from having too much stock or too much of your money tied up in capital equipment. From a financial perspective it is always better to ensure as little stock as possible to keep cash flow strong. So, the stock level should be as close to demand as possible.
If you ever watch Ramsay’s Kitchen Nightmares, a common problem is that the head chef is over-ordering food which then rots and gets thrown away. This is costing a fortune. If the owner had looked at his balance sheet regularly he may well have spotted this problem sooner.
Current assets
This covers things such as cash in the bank, money in the till and anything you are owed. On the face of it this is all good and the higher the better.
But if you look at the above example, the value of current assets for Joe Bloggs Ltd has gone up by £5,000 in one year due to the increase in debtors (people who owe it money).
This is great if these payments will be received quickly, but if instead it indicates slow payment and bad debts it is a different story. If I were a director of this business I would be worried and want to investigate this number further.
Creditors
In here is the bad news: the amount of money you must pay out over the coming year. So you should include in here things that you contractually have to pay out, such as office lease and loan repayments, but not things you have not yet purchased such as more stock.
Employee costs would not go here, but amounts owed to you as a director, for instance through loans, would.
Net assets
This is calculated from the total assets minus the total liabilities. If this figure is positive then the company is solvent and if it is negative (an amount in brackets) the company is insolvent and extra funds are needed.
For the example above, in its first year of trading (2016) the business made a loss and the shareholders needed to put in £2,943 of extra funds. In the following year, the business increased sales and made a fractional profit, though much of this income was yet to be received.
Other insights
Using the balance sheet there are certain ratios you can calculate to see how your business is performing. Examples are:
The Current Ratio (also known as the Working Capital Ratio) measures your ability to pay short-term and long-term obligations. The current ratio considers the current total assets of a company (both liquid and illiquid) relative to that company’s current total liabilities. Its formula is:
Current Ratio = Current Assets / Current Liabilities
The current ratio is called ‘current’ because, unlike some other liquidity ratios, it incorporates all current assets and liabilities. A ratio of under one is bad as it indicates your company’s liabilities are greater than its assets. It also suggests that you would be unable to pay off your obligations if they came due at that point.
The Quick Ratio is a more conservative version of the Current Ratio and provides a more rigorous assessment of a company’s ability to pay its current liabilities. Its formula is:
(Current assets – Inventory) / Current Liabilities
The rule of thumb is those businesses with a Quick Ratio of one or above are probably in good shape for paying their liabilities, while those with below this are probably heading for trouble.
If the latter is your business, you need to start getting more liquidity through getting debts paid, reducing expenditure and consider getting a loan.
Does the balance sheet show what my business is worth?
Some business owners make the mistake of thinking that the equity amount on the balance sheet is the worth of a business.
In reality this is rarely the case as it doesn’t include goodwill (the worth of the customers built up by the business) and your valuable knowhow. So, your business can be sold for much more than the equity amount on the balance sheet.
Lee Murphy the CEO and founder of cloud accounting software firm, Pandle.


Hi, the balancesheet template image on this page is illegible.